The Chart Display
Pelorus Nav renders official NOAA electronic charts (ENC) as vector tiles with standard IHO S-52 symbology — the same symbols found on commercial chartplotters and paper charts.
Chart modes
The button in the bottom-left corner (next to COB) controls how the chart follows your vessel. Tap it to cycle through:
- Follow — the chart stays centered on the vessel, north up.
- Course-up — centered on the vessel, rotated so your course is up.
- North-up — north up; the vessel can move across the screen.
- Free — the chart stays where you put it.
Panning the chart by hand always switches to free mode; tap the button to lock back onto the vessel. The button's icon shows the current mode, and it dims when there's no GPS fix. The zoom buttons and the compass in the top-right corner are not a look-away: they keep whatever mode you're in. (Pinching also pans, so it switches to free.) You can hide that button group in Settings → Appearance.
Two behaviors make the following modes work like a dedicated plotter:
- Look-ahead offset — while you're underway (above about a knot), the vessel doesn't sit dead center: it slides back from center along your course so most of the screen shows the water ahead of you, where the next buoy is, rather than the water you've already crossed. Below a knot the boat returns to center.
- Auto-return — if you've panned away in free mode, a minute of no interaction snaps the chart back to your vessel (and closes any open panels), so a glance at the helm always shows your boat. This is the "Close dialogs & recenter when idle" setting (Settings → Appearance, on by default) — the same one worth turning off while exploring the app ashore.
Instruments
The instrument panel (toggle with INST) shows large SOG and COG readouts, plus a GPS health badge. When the GPS fix goes stale the badge reads NO GPS and the values blank rather than showing outdated numbers. While navigating a route it grows a navigation section — see Following a route.
On phones in landscape the instruments sit in a side column by default; Settings → Appearance → "Landscape instrument layout" can move them to a top bar instead.
A separate small status strip in the bottom-right corner (tap ▲ to expand) shows cursor coordinates, zoom level, and the raw GPS position, source, and update rate — useful for checking that an external GPS is feeding data.
Detail levels
Electronic charts carry far more information than you usually want on screen. The Detail slider (Settings → Appearance) picks the level:
- Base — coastline, depth areas, and major aids only.
- Standard — the working default: buoys, beacons, depth contours, soundings, hazards.
- Standard+ and Full — progressively more labels, seabed detail, and minor features.
Zooming in also reveals more detail at any setting, so "Standard" plus zooming covers most situations.
Layers
Settings → Charts & Layers has checkboxes for optional layer groups: routing measures, restricted and caution areas, anchorages, cables and pipelines, seabed characteristics, depth-contour labels, light sectors, and more, plus the Tides & Currents overlay.
Charted Currents shows the static current arrows printed on the chart itself — notably the Gulf Stream along the US East Coast, with set and drift (e.g. "3.5 kn"). These are long-term averages from the chart, not live predictions; for predicted tidal currents at a station, use the Tides & Currents overlay. The charted arrows are most useful offshore, where there are no prediction stations.
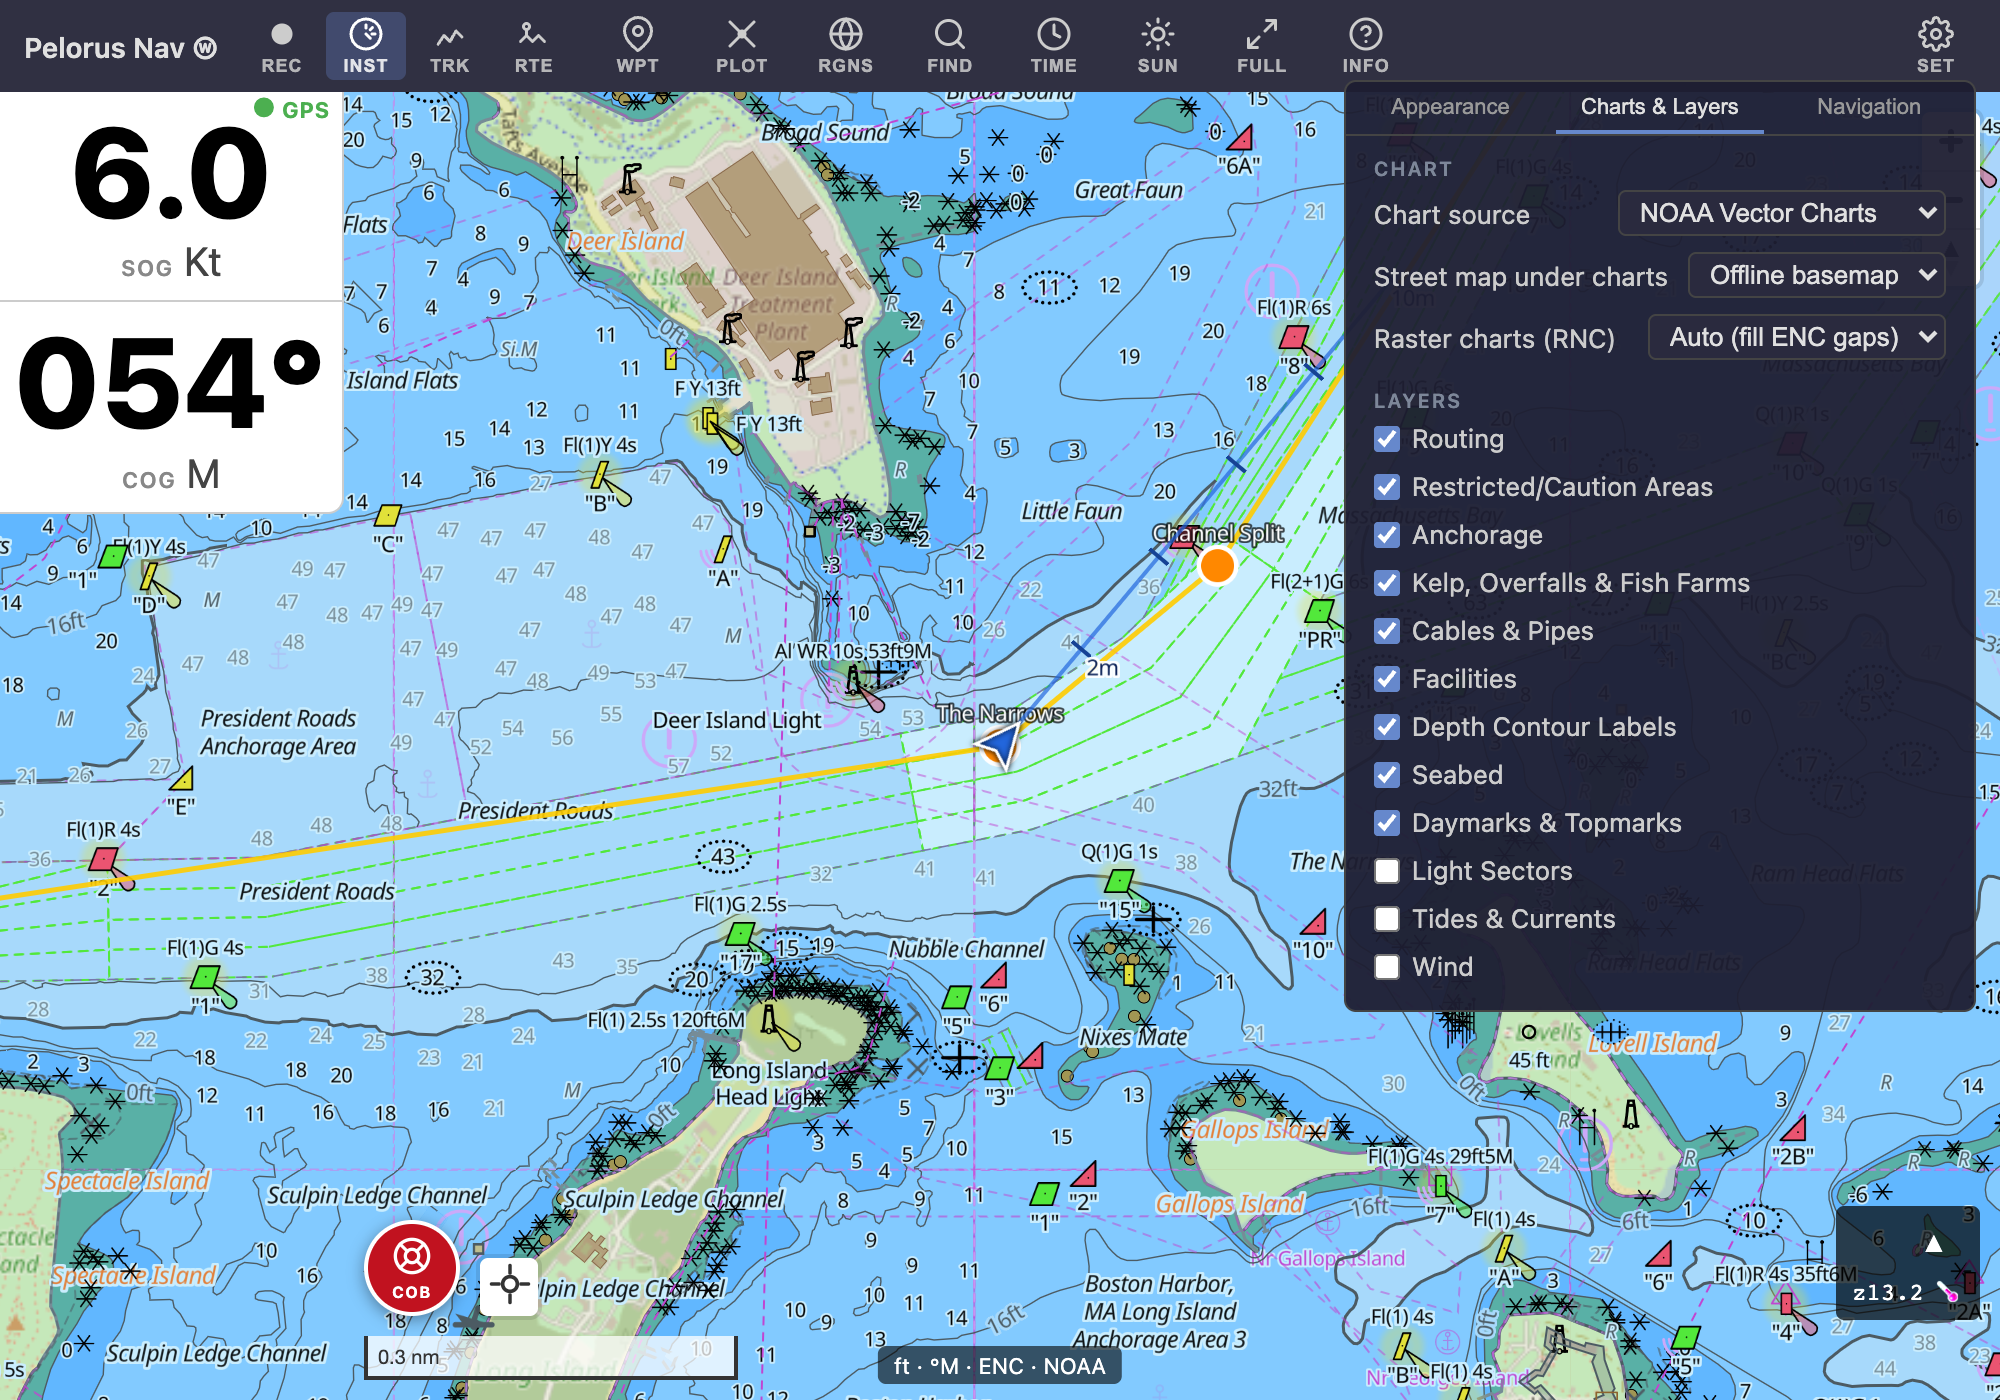
Depth shading (the blue tint bands) is configured on the Appearance tab — set the Shallow, Safety, and Deep thresholds to match your draft, and the chart colors water depths accordingly.
Display themes
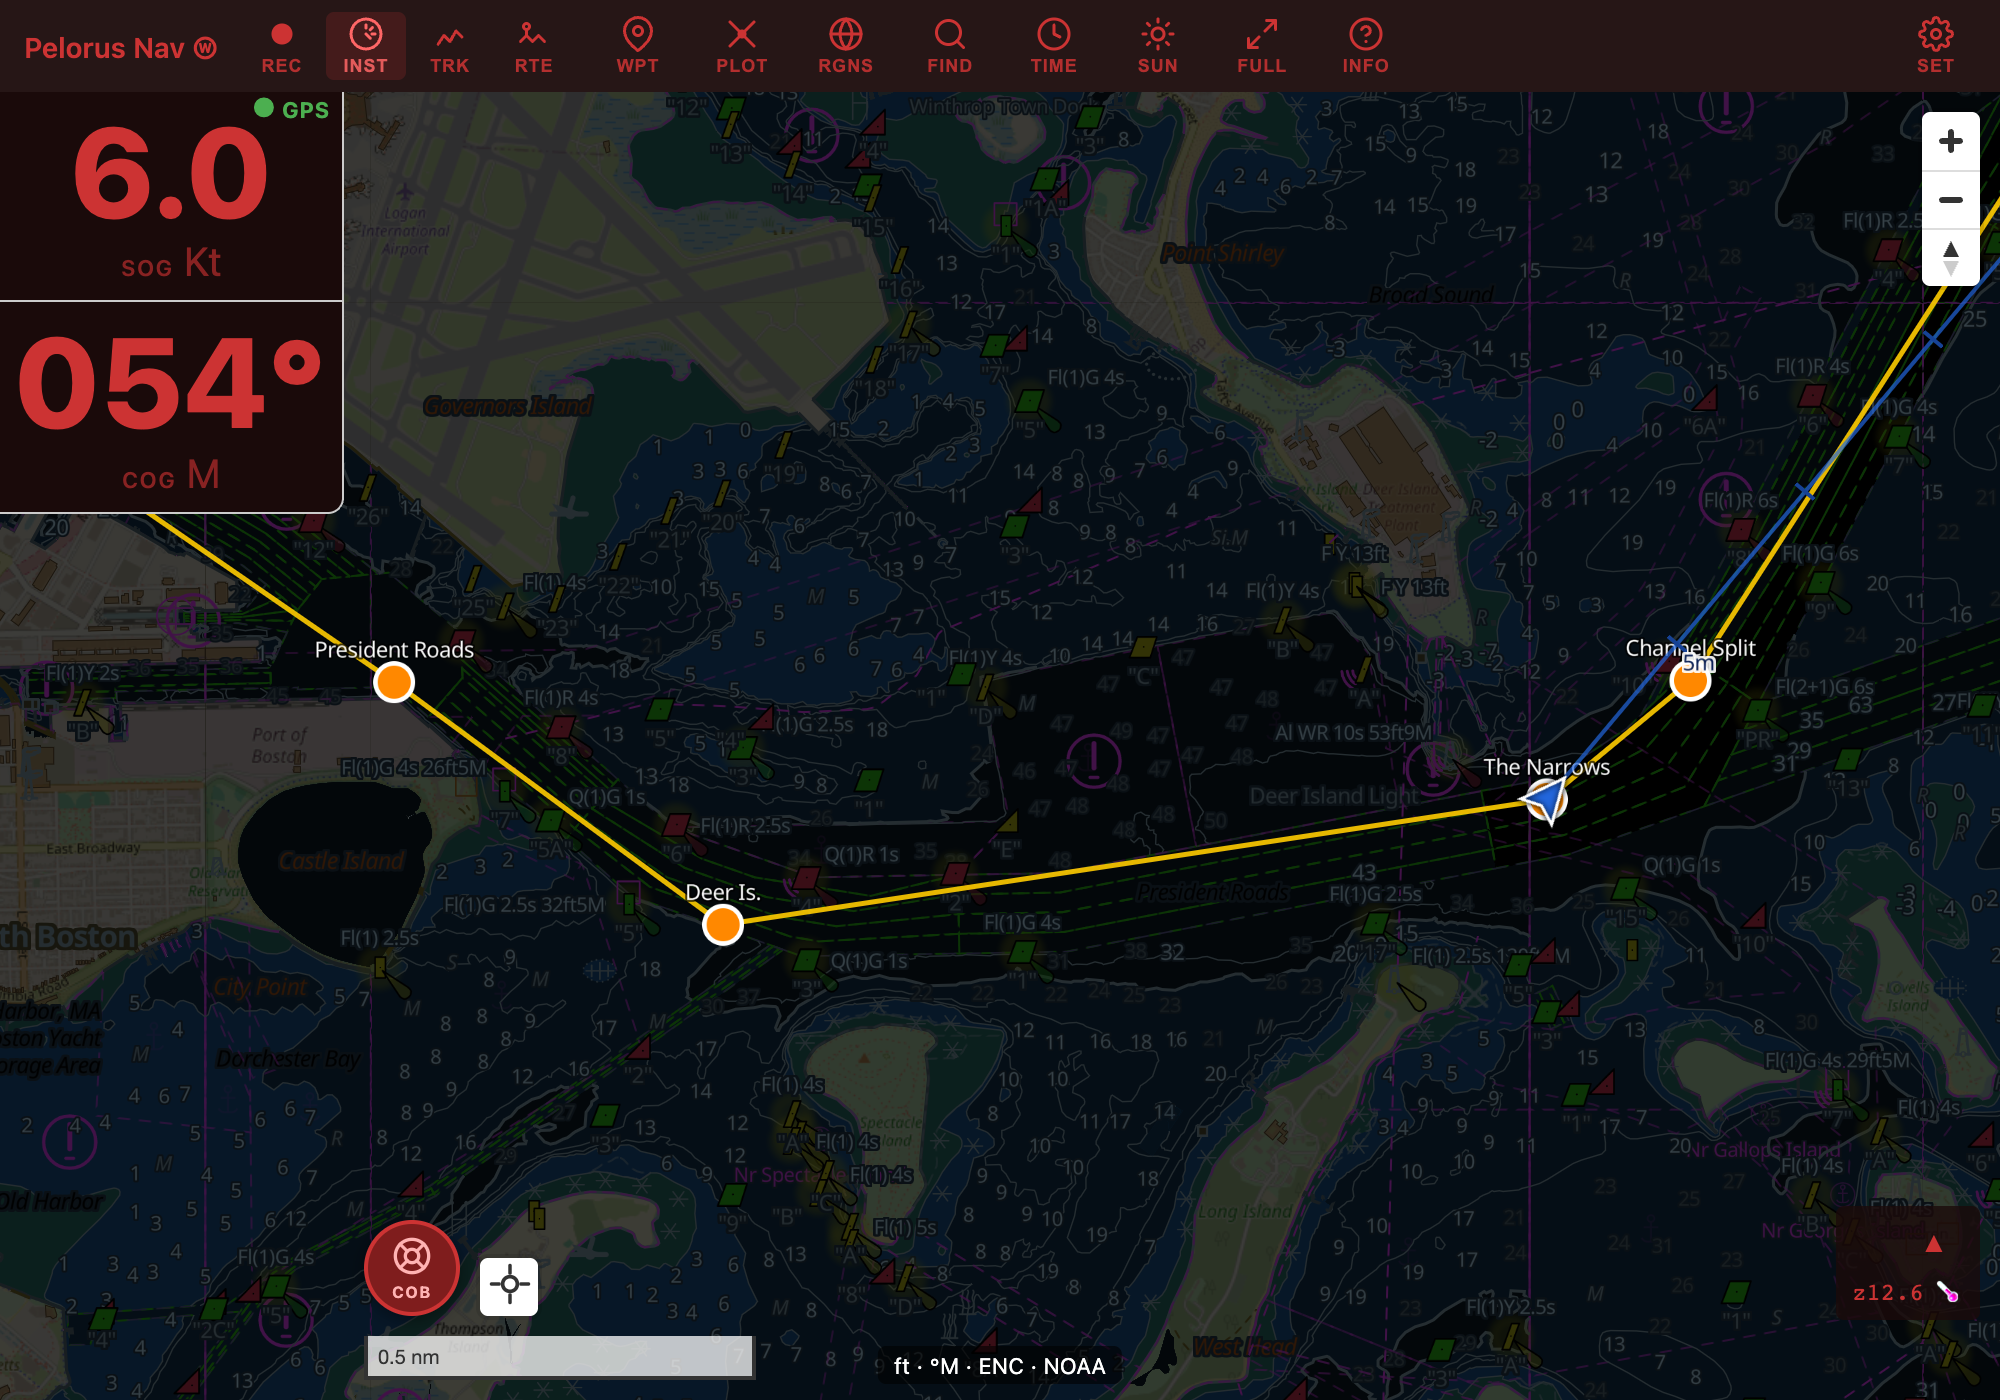
Day, Dusk, Night, and E-ink themes recolor the entire chart using the official S-52 color palettes. Night mode keeps the chart readable without destroying your night vision:
The E-ink theme is a high-contrast monochrome palette for e-paper devices.
Identifying features
Tap any charted object — a buoy, light, wreck, depth area — and an info panel shows its attributes. When several features overlap at the tapped point, arrows in the panel cycle through them. Your own routes and waypoints are tappable too: a route's card shows its length and waypoint count (and tapping selects the route, as in the Routes panel), and a button jumps straight to it in the Routes or Waypoints panel.
Finding places
FIND searches the charts by name — harbors, islands, buoys, lights — ranked with nearby results first. It works offline (the search index downloads with each chart region), and typing coordinates offers a "go to coordinates" result instead. Pick a result and the chart flies there.
The map context menu
Right-click (or long-press on touch screens) anywhere on the chart:
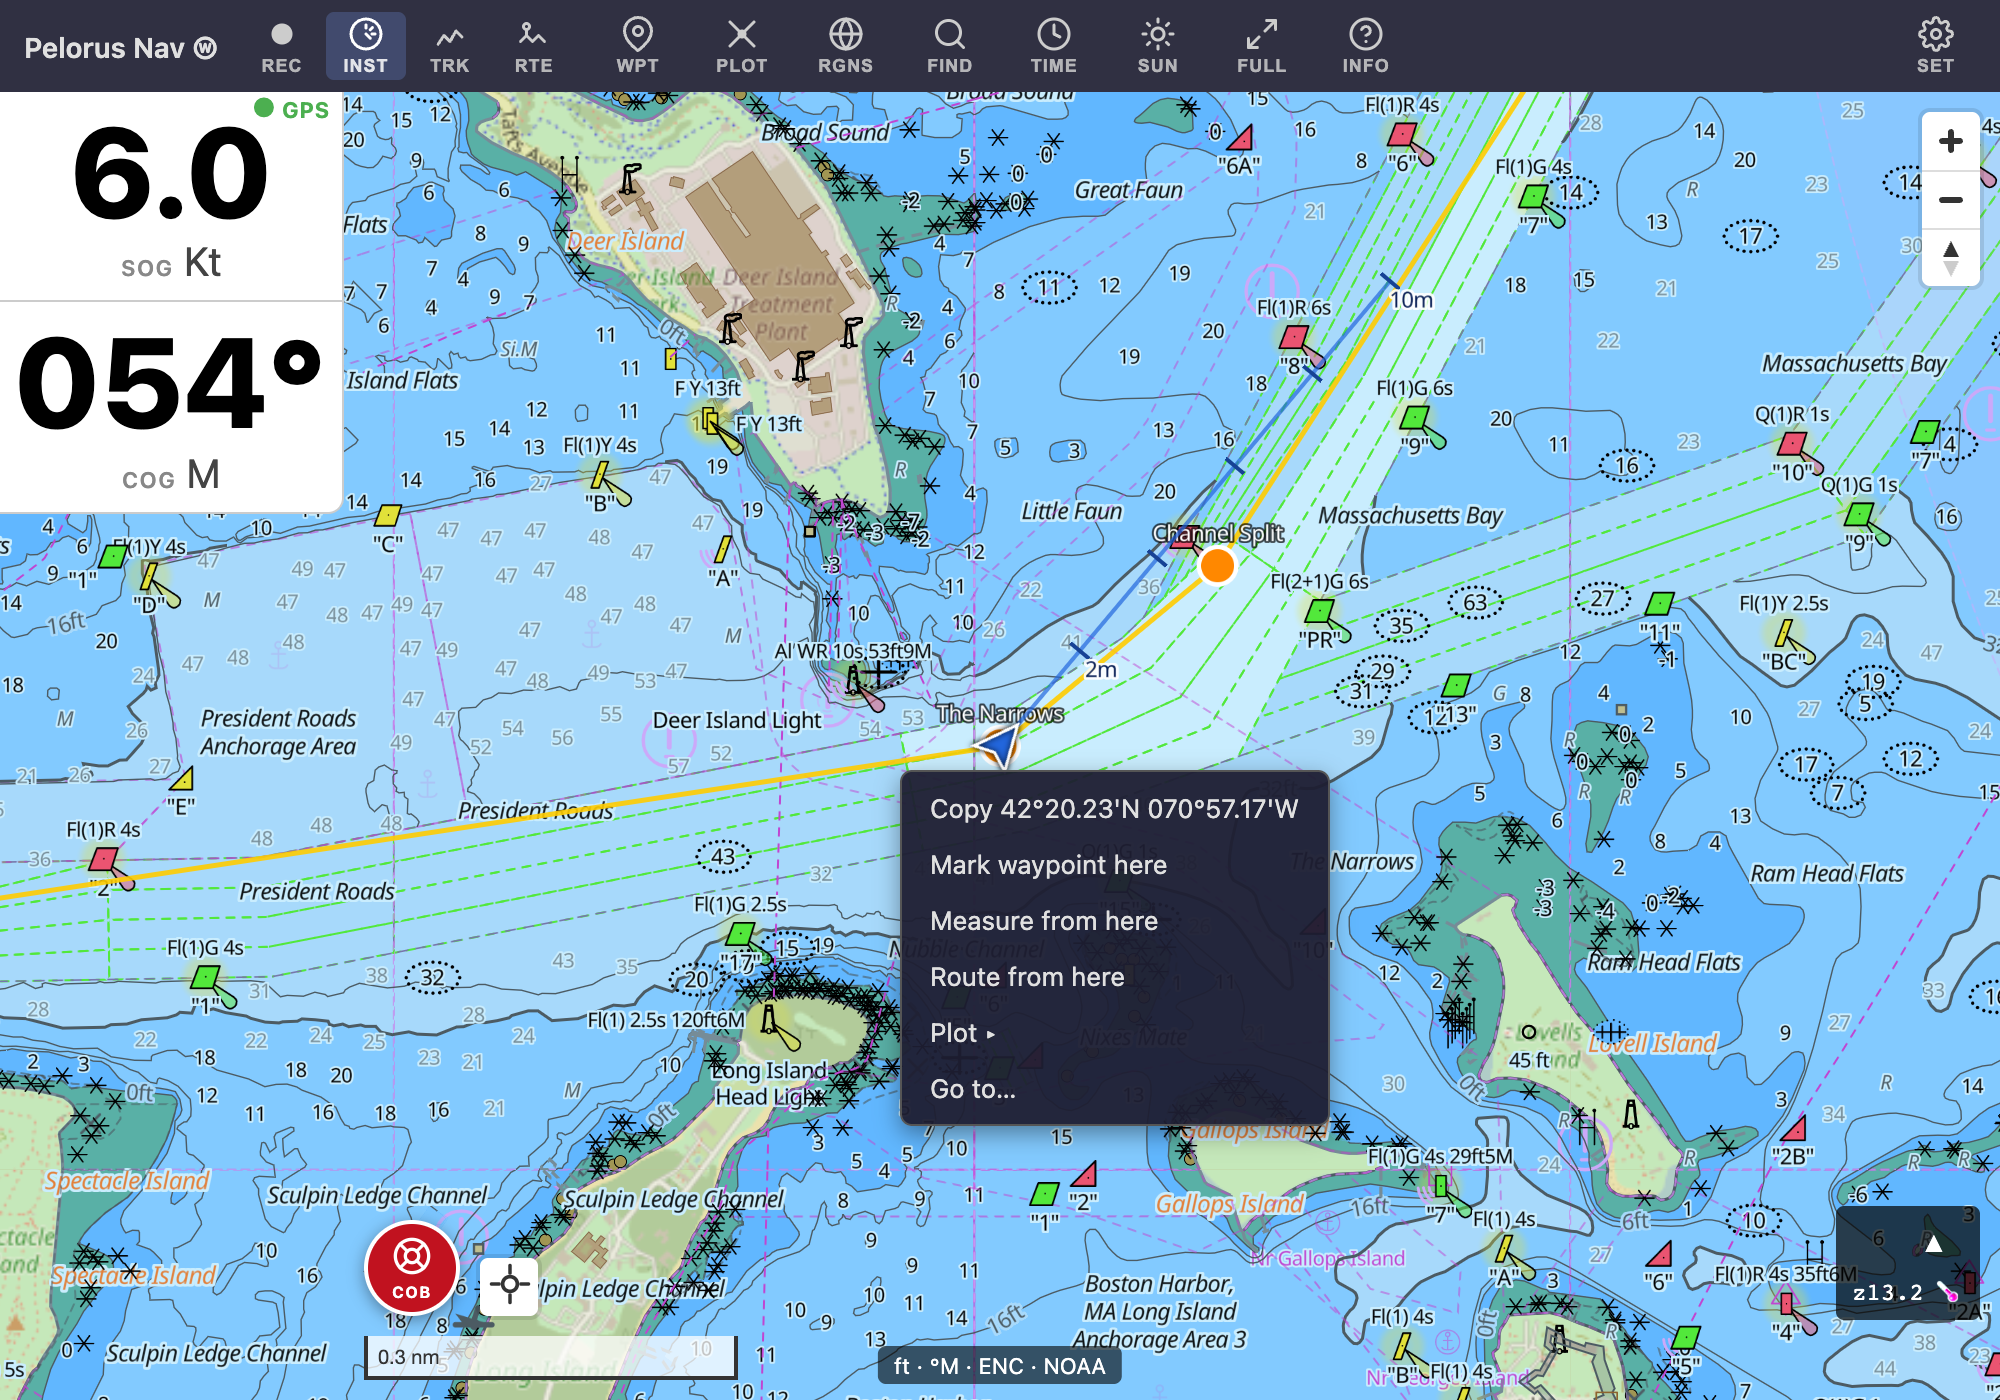
- Copy … — copies the tapped position's coordinates.
- Navigate to here — starts navigating straight to the tapped point. The target is a temporary waypoint: it disappears when you arrive (within the arrival radius) or cancel the navigation.
- Mark waypoint here — drops a waypoint, auto-named after the nearest charted feature.
- Measure from here — a tape measure: tap points to measure range and bearing along a path.
- Route from here — starts route creation with this position as the first waypoint.
- Plot ▸ — manual plotting tools (bearing lines, distance arcs, position symbols) for traditional chartwork.
- Go to… — type coordinates and the chart flies there.
Waypoints on the chart
A waypoint dropped from the context menu — or brought in from another chartplotter by importing a GPX file — sits on the chart until you move or delete it.
To move one, press and hold it until it rings and the device buzzes, then drag it where you want and lift. The hold is deliberate: waypoints sit on the same chart you pan, and without it a pan that started on top of a waypoint would take the waypoint with it. If a move wasn't what you meant, the message that appears afterwards will undo it.
The Waypoints panel lists them all, with the same folders, bulk selection, and GPX import/export the Routes panel has. Tapping a waypoint's name there centers the chart on it and rings it — the quick way to see where one of a long list actually is — and double-tapping the name renames it.
Symbols
Edit a waypoint to change its symbol. There are two kinds:
- Meaning — Anchorage, Hazard, Fuel, POI. Each has its own fixed color, so a red mark is always a hazard and a blue one always an anchorage.
- Shape — triangle, circle, square, diamond, flag, pin, house, in any of six colors you choose. These mean whatever you decide: red triangles for lobster pots, green flags for good anchorages.
The shapes and colors are the ones Garmin and ActiveCaptain use, so an imported GPX keeps the coding you already had — a red triangle stays a red triangle — and exports go back out under names those chartplotters recognize.