Tides, Currents, Wind & Sun
Pelorus Nav overlays predicted conditions directly on the chart, and lets you scrub them up to 48 hours into the future. The tide and current overlays are enabled in Settings → Charts & Layers (off by default); sun times are always a tap away.
Tides & currents
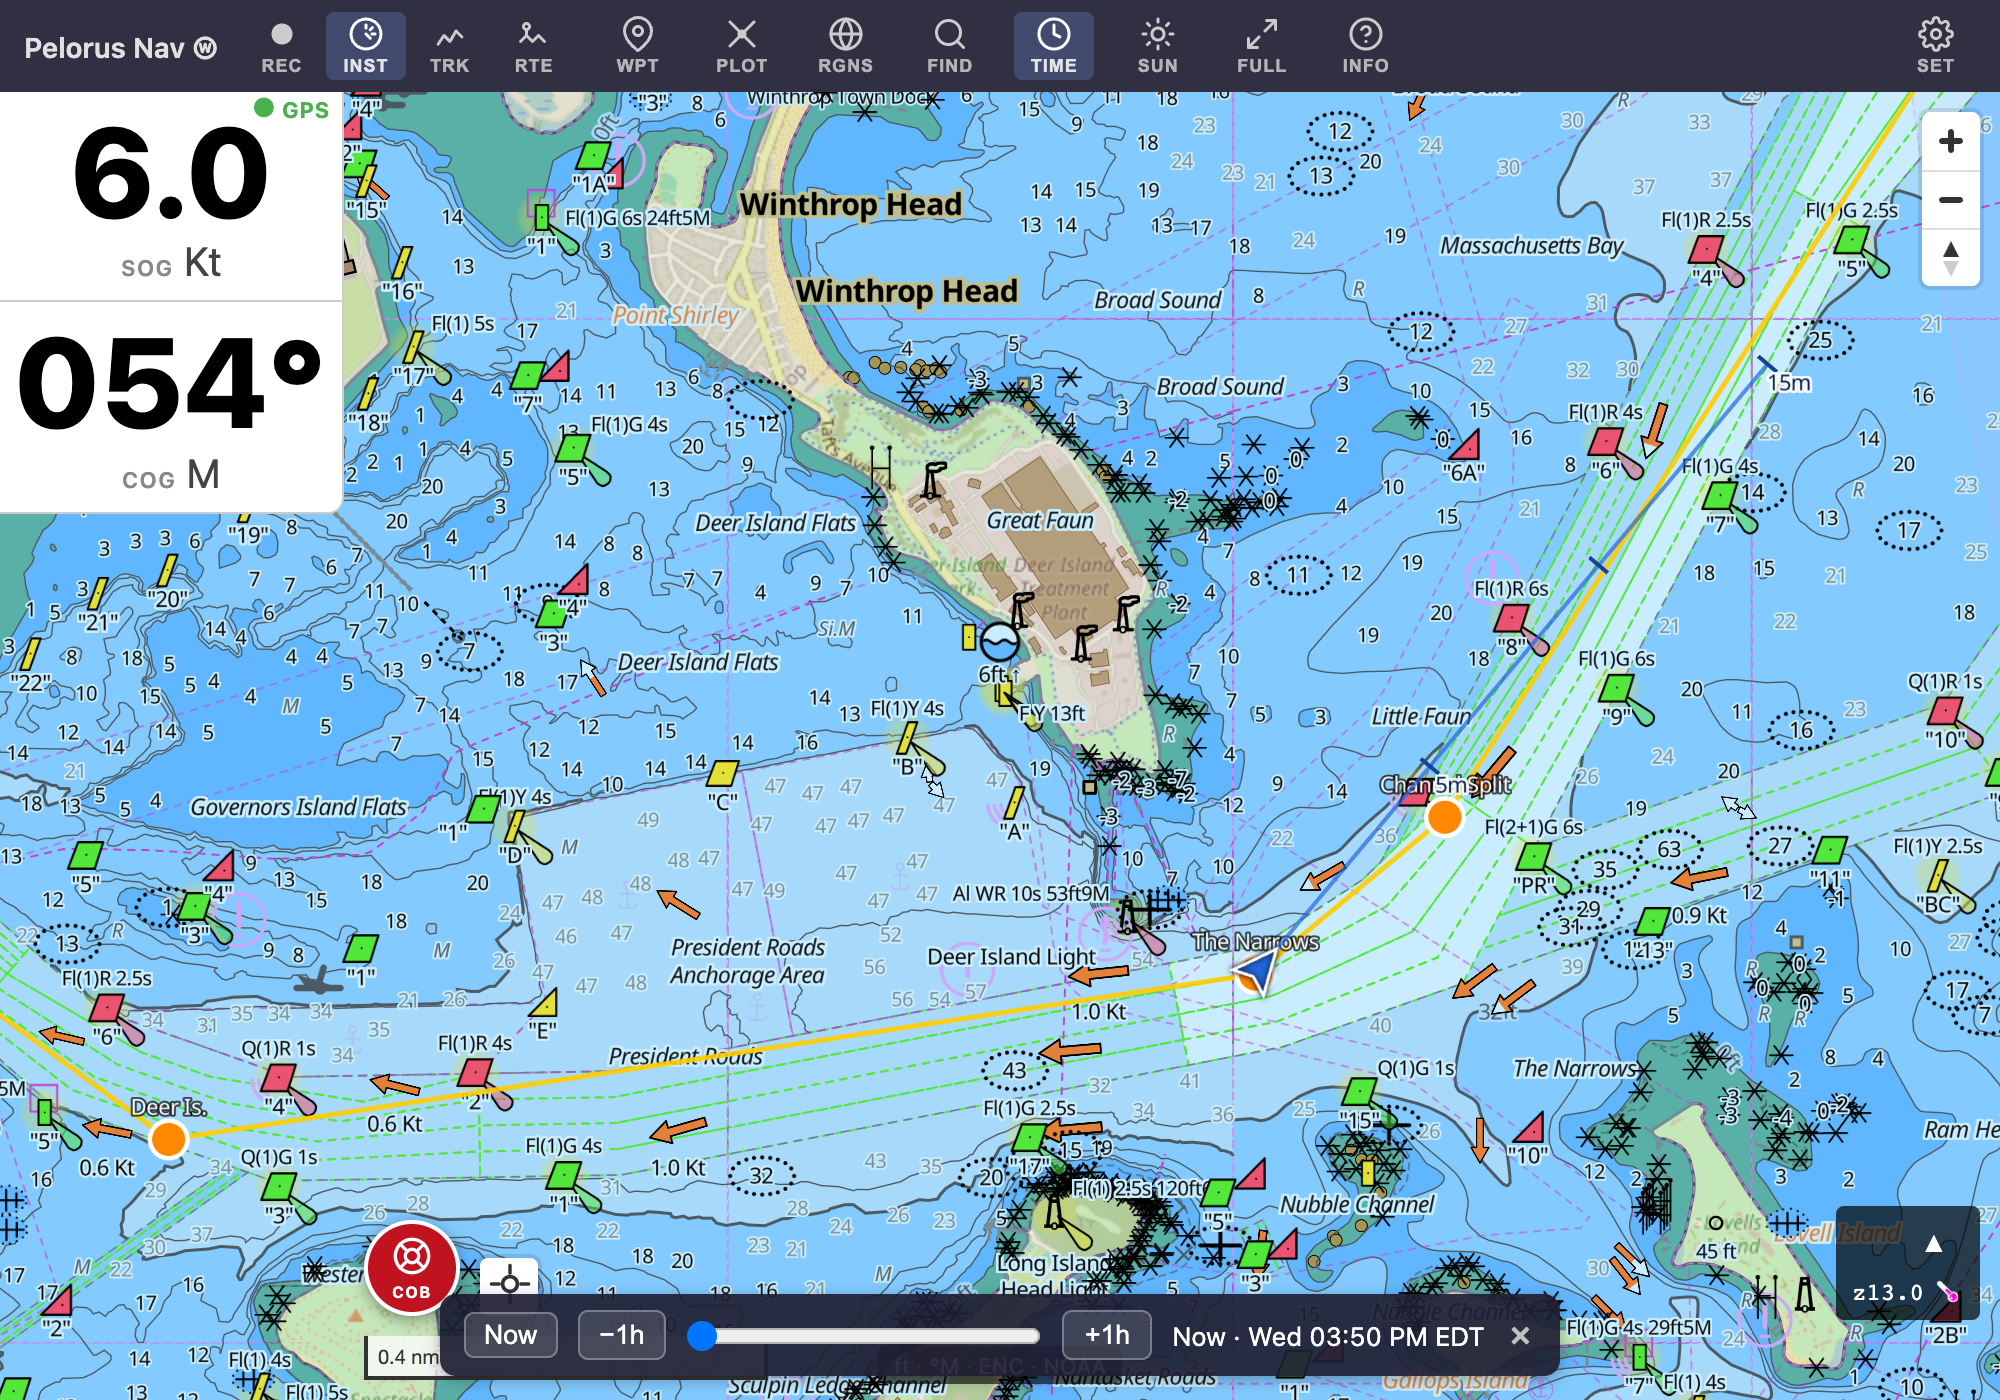
Turn on the Tides & Currents layer group and zoom into a harbor:
- Tide stations
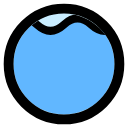 show the predicted water height with a trend arrow —
 6ft ↑means six feet and rising. The icon fills with the tide: nearly empty at low water, full at high. - Current stations
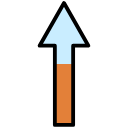 draw an arrow pointing the direction the current sets, its length scaled by strength, with the drift labeled as you zoom in (e.g.
 0.5 Kt). At slack, a pair of hollow arrows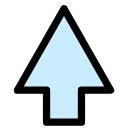 points out the flood and ebb directions instead.
Predictions are computed on the device from NOAA harmonic data bundled with the app, so they work fully offline — no network signal required.
Tap any station for its schedule:
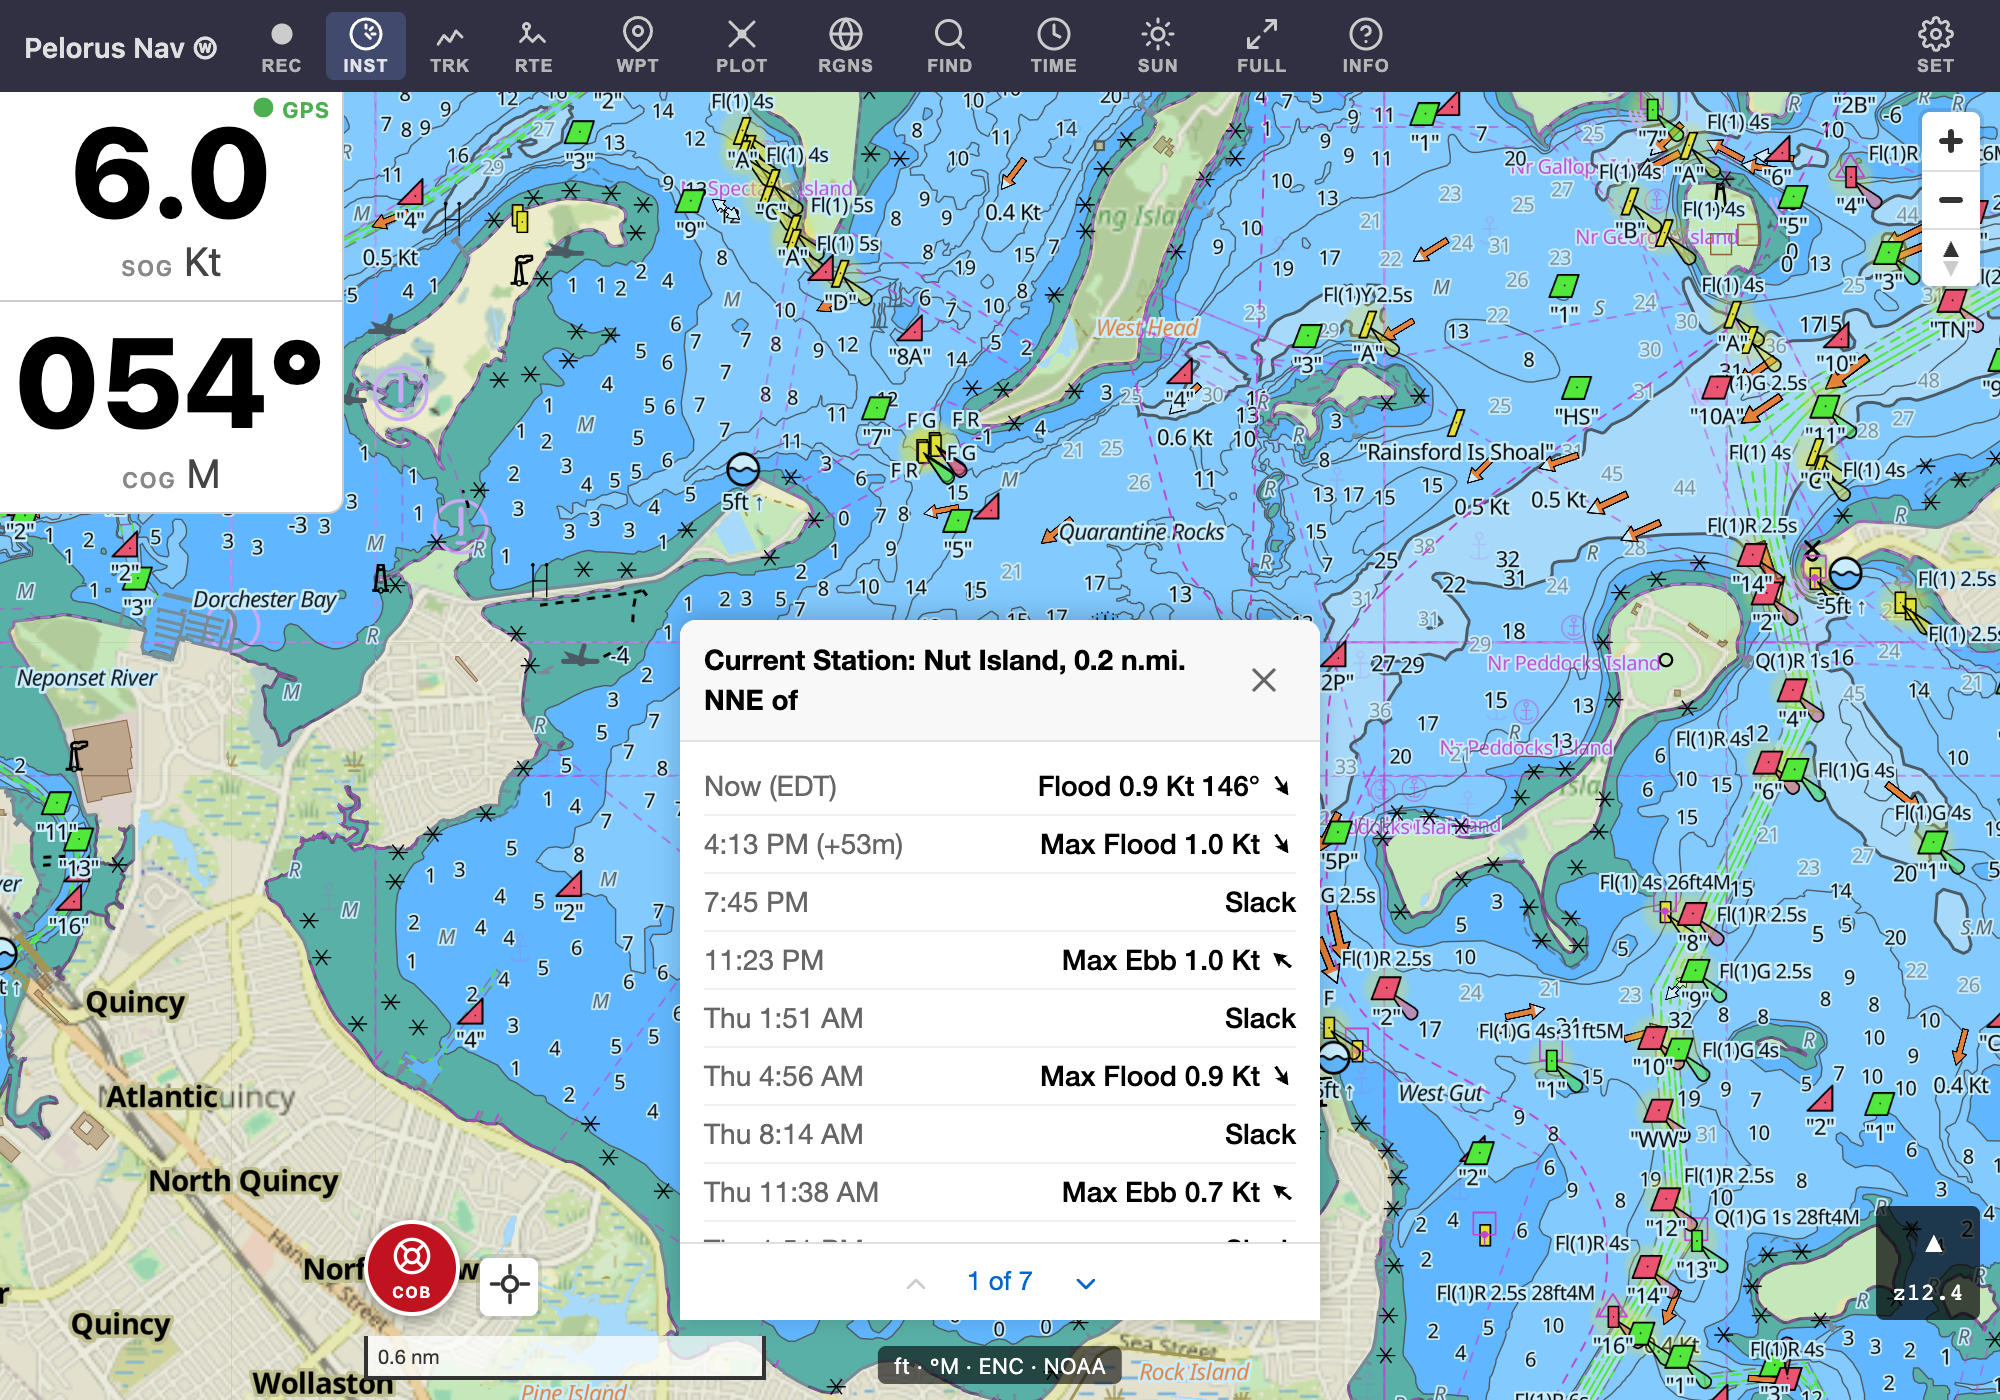
The panel shows conditions right now, then the coming day's events — highs and lows for tide stations; max flood, slack, and max ebb for current stations. Secondary stations (predicted by offsets from a nearby reference station) are labeled as such and are approximate.
The nearest tide station
Tap TIDE in the top bar (in the ☰ menu on a phone) for the tide station nearest your vessel — or nearest the chart centre when there is no GPS fix — without hunting for it on the chart or turning the layer on. The card opens with its distance and the same schedule as a tap on the station; Show on chart flies there. Nearby stations whose next high or low differs by more than ten minutes appear as buttons under the schedule, each showing its distance and next event, so you can pick the one that fits your spot; stations that agree within a few minutes are left out as the same answer.
The time bar
The chart normally shows conditions now. Tap TIME and a bar appears at the bottom of the chart: drag the slider (or step ±1h) to any point in the next 48 hours, and every prediction overlay — tide heights, current arrows, wind barbs — updates to show that moment. The readout shows the offset and wall-clock time (+3h · Wed 06:18 PM EDT).
Answer questions like "which way will the current be running in the canal at 5 o'clock?" before you commit to it. Now (or closing the bar) snaps back to live conditions; your vessel and GPS always stay in real time.
Wind
The Wind layer group draws standard meteorological wind barbs over the chart — the staff points from the direction the wind is coming from (so the arrow "flies with the wind"); a half barb is 5 knots, a full barb 10, a pennant 50. This barb  is 15 knots out of the south — a full barb plus a half barb, with the staff trailing toward the wind's source:
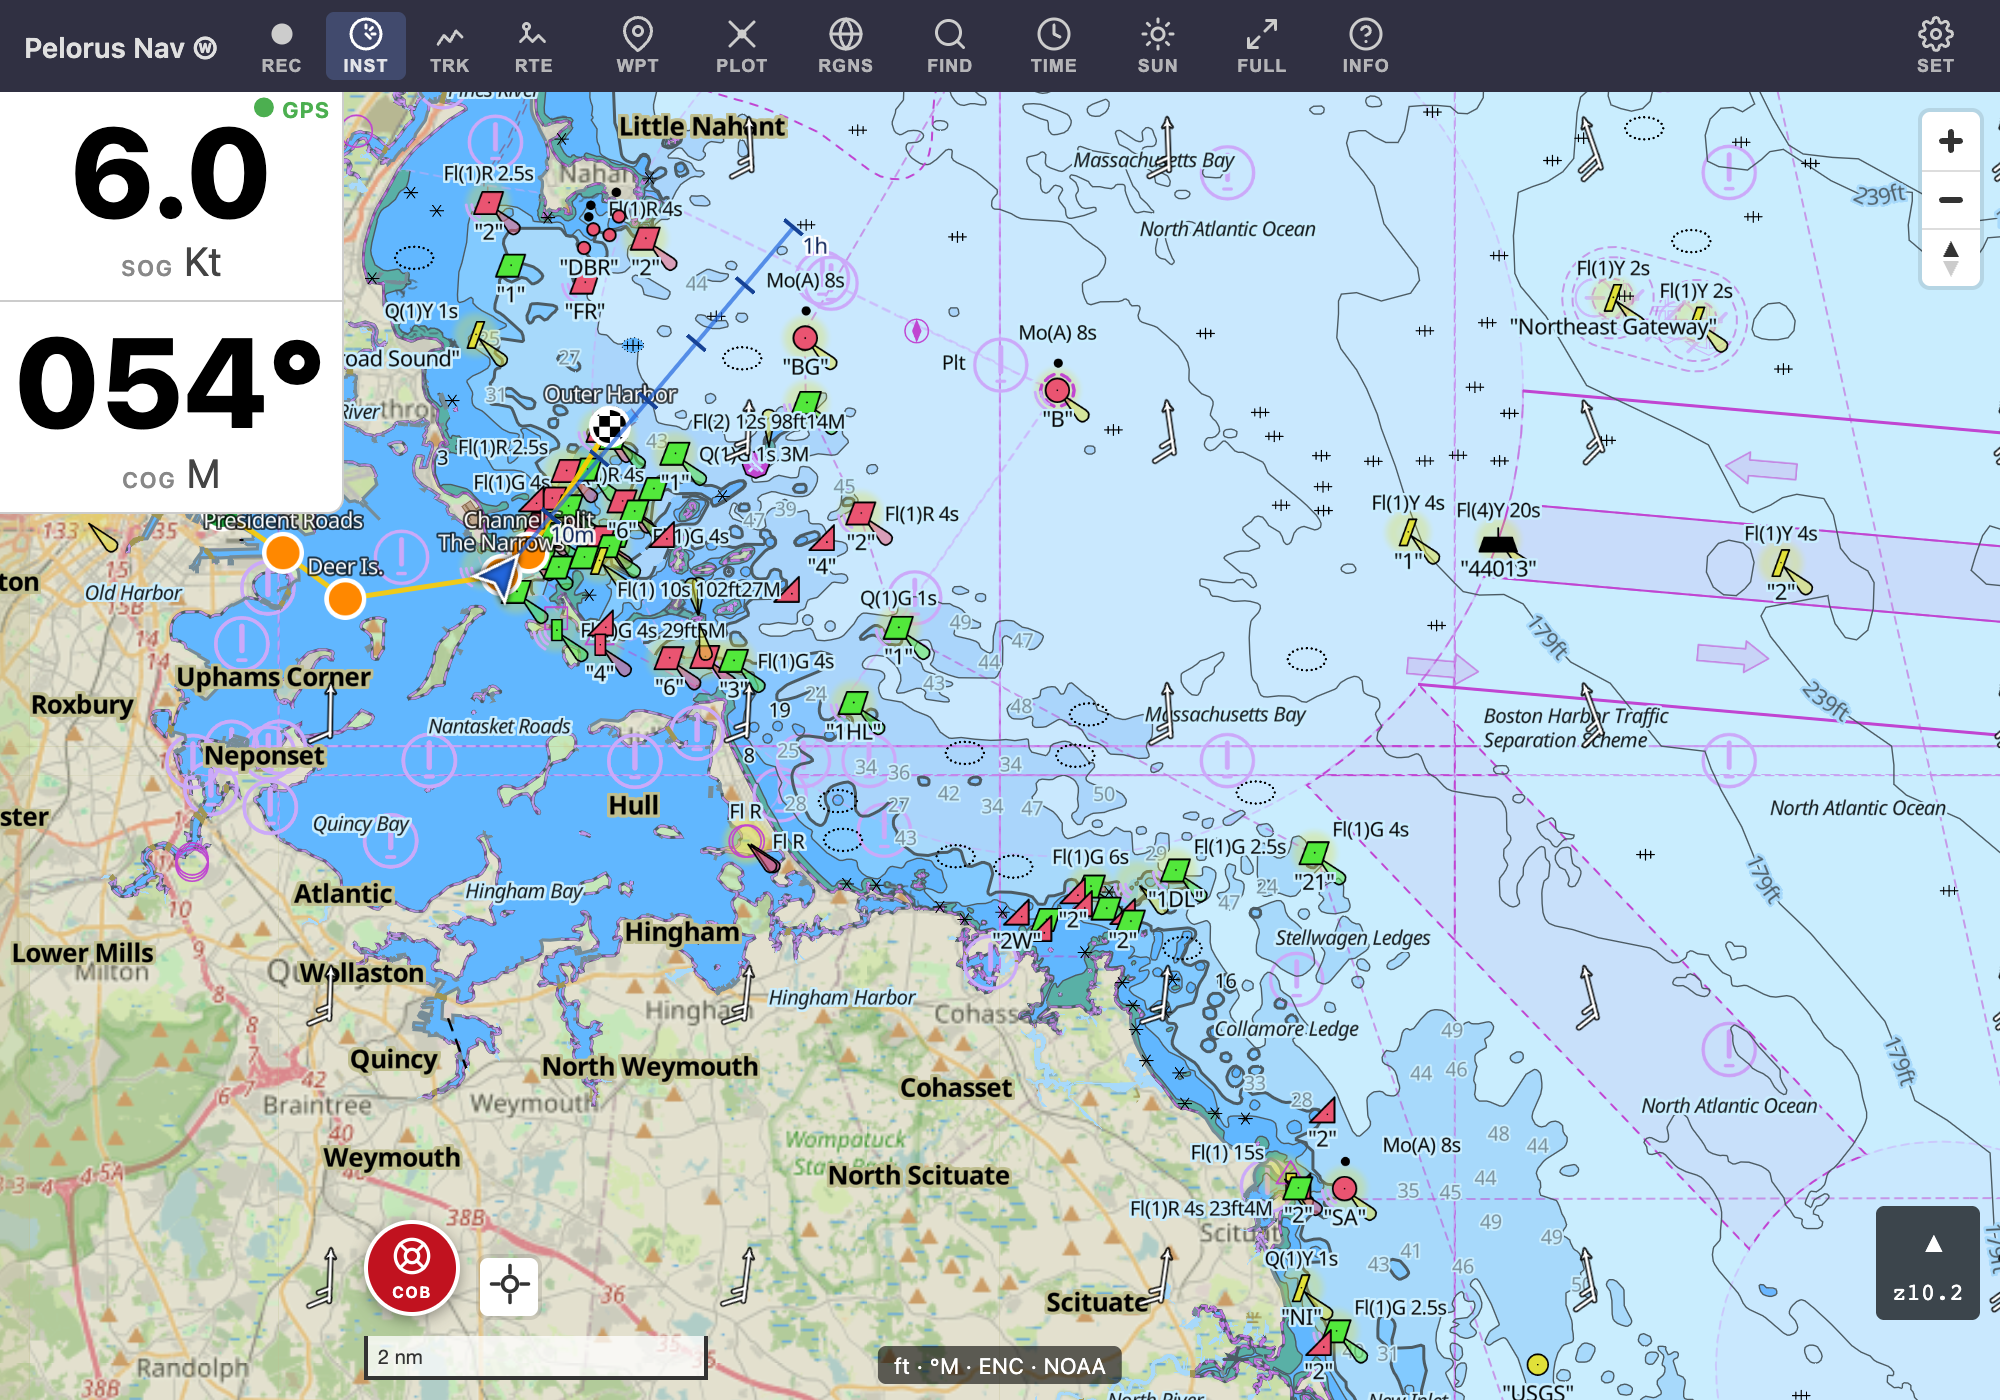
Forecasts come from Open-Meteo, so this overlay needs an internet connection (it fetches a 3-day forecast at a time, and the time bar scrubs within it without re-fetching). A status chip tells you when wind data isn't available.
Sun & twilight times
Tap SUN for a week of dawn, sunrise, sunset, and dusk times at the chart's location (dawn/dusk are civil twilight — roughly when you can still see to work on deck):
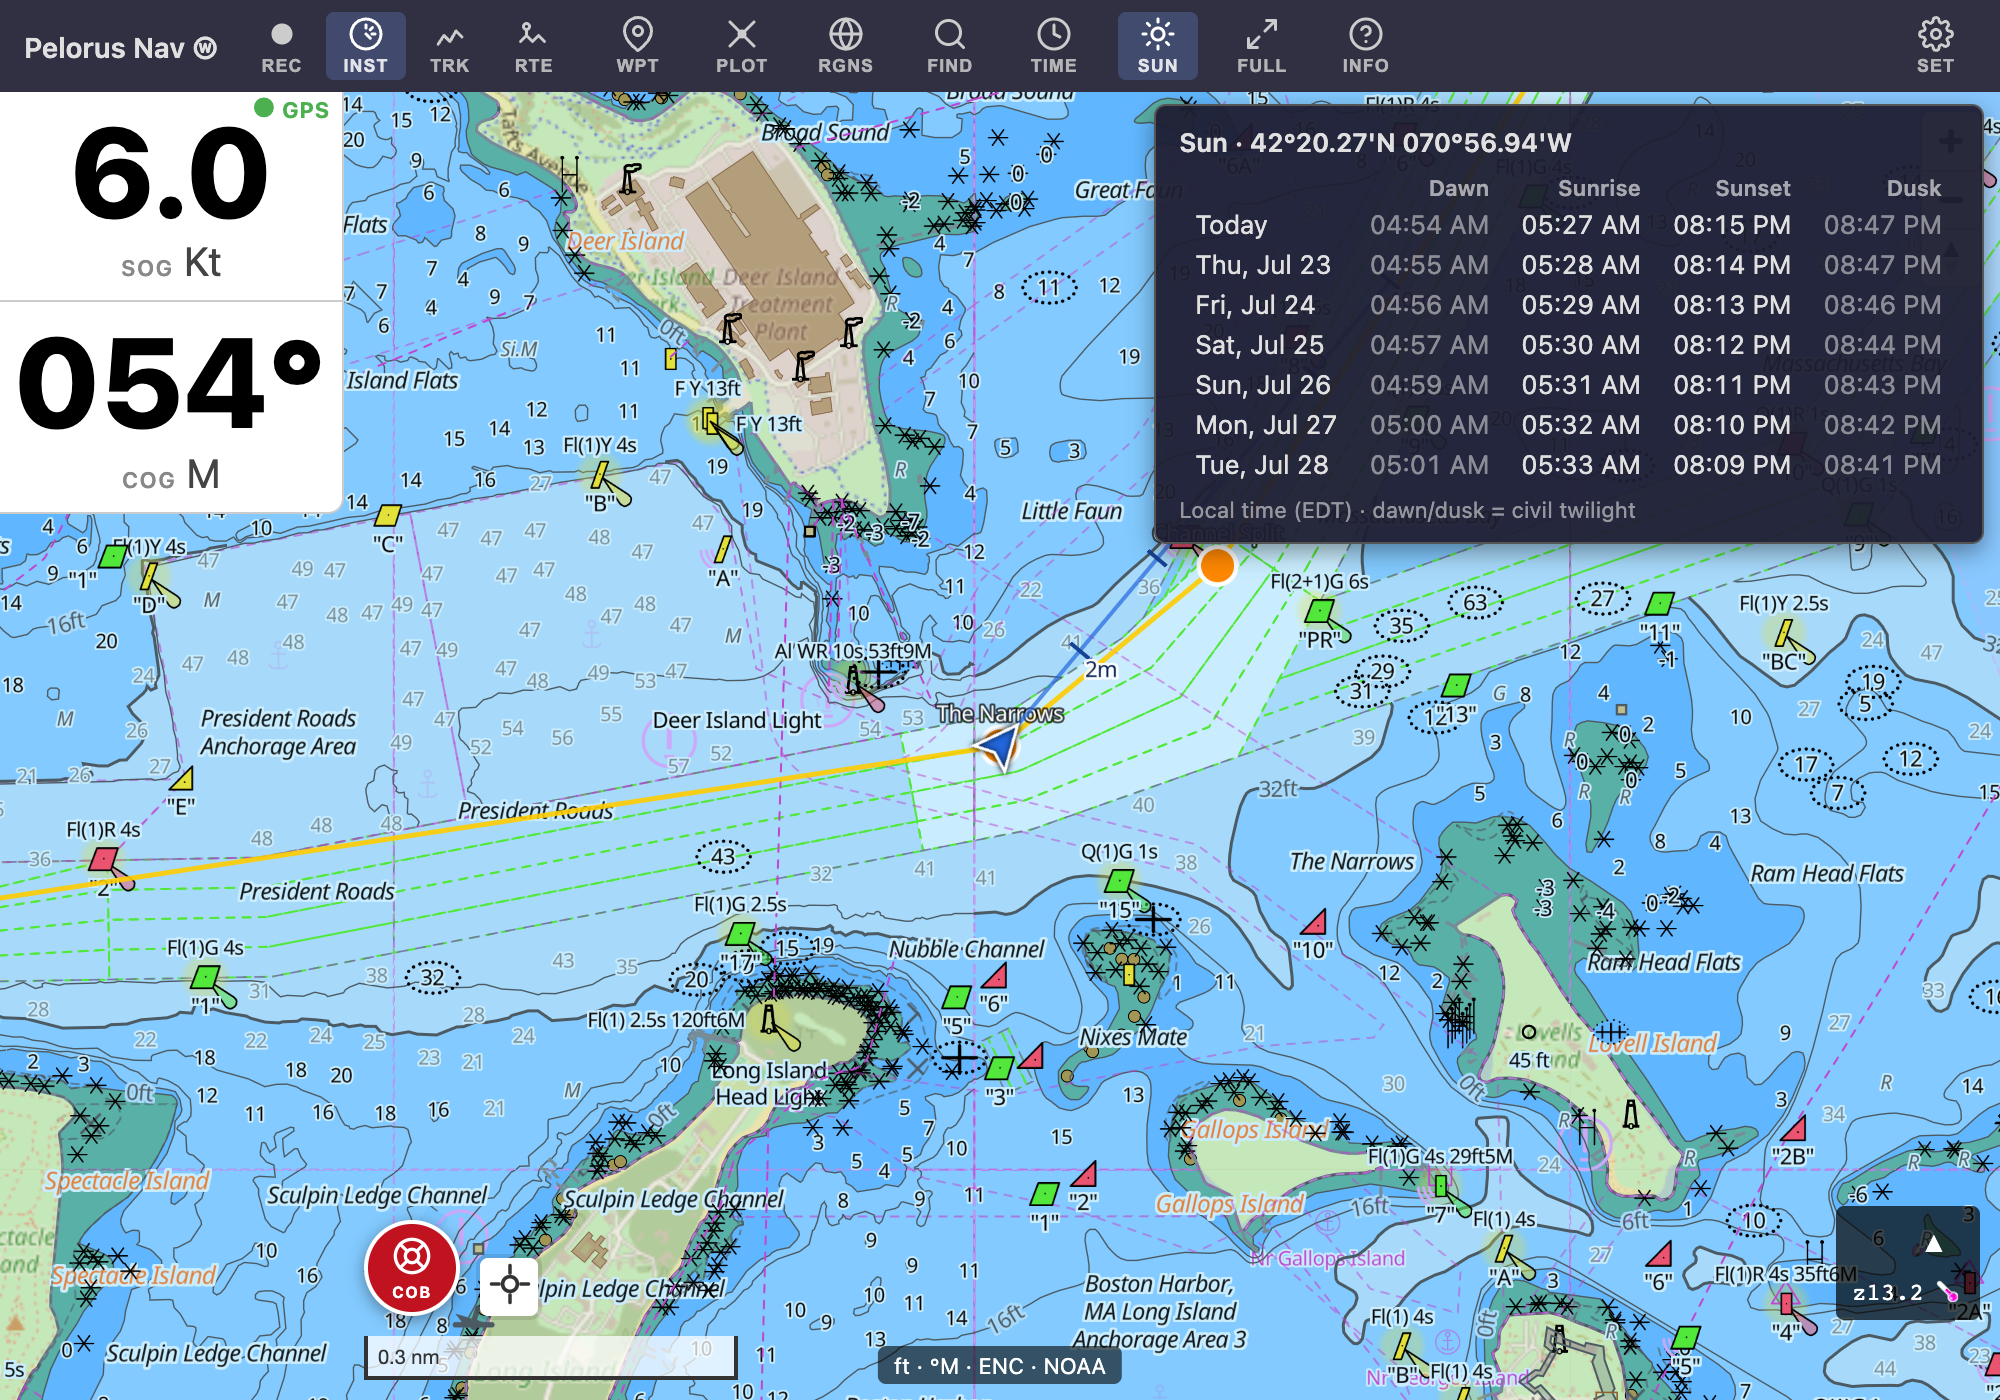
Computed offline, like the tides — handy for planning a dawn departure or making sure you clear the harbor entrance before dark.