Tracks
A track is a recording of where you actually went — position, speed, and course at each GPS fix. Record every outing; tracks are cheap, and the viewer turns them into a story of the day.
Recording
Tap REC in the top bar to start recording; it turns into a stop button while active. The Tracks panel has the same Record/Stop control, and the recording track's row updates live with its running duration and distance.
Recording is robust by design: it survives an app reload or restart and, in the native apps, continues in the background with the screen off.
The Tracks panel
Open Tracks (TRK). Each row shows the track's color, name, and a summary — date, duration, distance. From the row you can view it in the Track Viewer, export it as GPX, show/hide it on the chart, or delete it. Click the color dot to change the track's color; double-click the name to rename it. The header buttons import GPX files and export or delete all tracks at once.
A season of recordings gets long, so tracks can go in folders and be worked on in bulk exactly as routes can: a folder's eye shows or hides everything in it, and the ticked-box button in the header (or a long press on a row) lets you select several and move, show, hide, or delete them together.
As with routes, tracks live only on the device — export now and then for backup, or to move a track to another device or app. Re-importing a file you have imported before updates what is already there rather than duplicating it, so the same file can be used to keep two devices in step.
The Track Viewer
The eye-opener. Tap the activity button on any track's row:
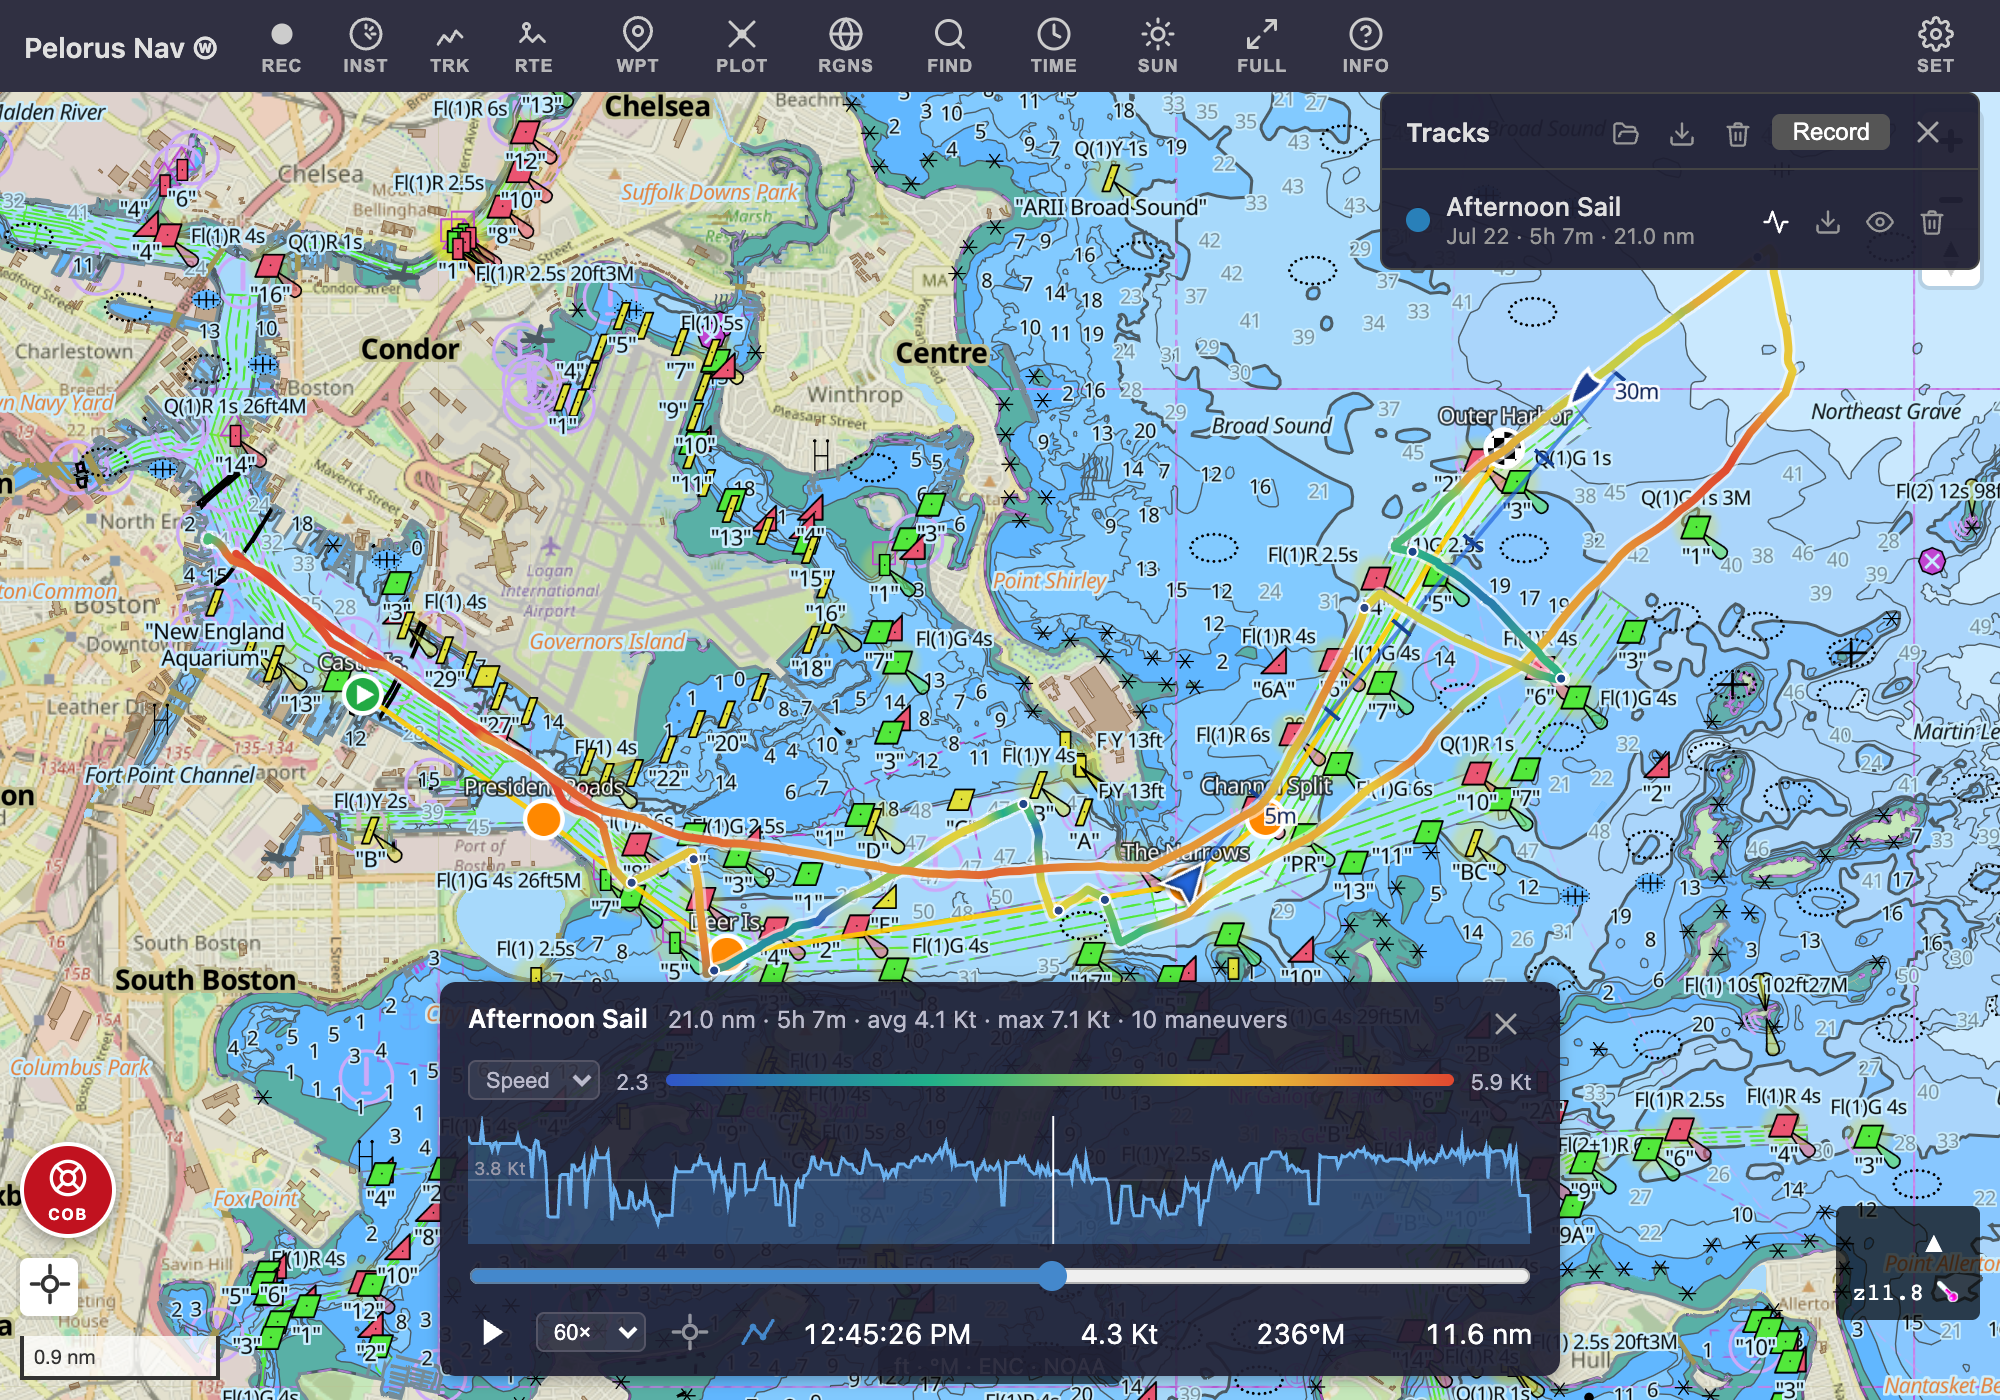
The track is drawn on the chart colored by speed (switchable to course or time), with a legend showing the color range. The header gives the headline numbers: distance, moving time, average and max speed, and how many maneuvers (tacks, jibes, big turns) it found — each one marked on the chart; tap a marker to jump the cursor there.
Below that, a speed-profile chart shows boat speed across the whole track. Tap anywhere on it (or drag the slider) to put the cursor at that moment — the readouts show the time, speed, course, and distance-run at that exact point, and the cursor moves along the chart track to match. So "what were we doing at 12:45?" and "how fast were we through The Narrows?" are both one tap away.
More tricks:
- Play — replay the day at up to hundreds of times real speed and watch the cursor sail the track. The follow button keeps the chart centered on it.
- Span stats — press and drag across a section of the speed chart to select it: the header switches to that span's distance, duration, and average/max speed. Perfect for "how did we do on the upwind leg?"
The viewer does double duty: the Preview route button in the Routes panel opens a route here as if it were a track, with a planning-speed box (e.g. @ 5 kn) that estimates elapsed time along the way.